Introducing the GlobalCORRIDOR Atlas and Database
The GlobalCORRIDOR Atlas and Database represents a collective effort to establish a comprehensive analysis of a planetary-wide, emerging geography of infrastructure corridors. We set out to investigate how the world is being (re)shaped through the contemporary proliferation of infrastructure corridor projects that are cutting across various territories, regions and spaces. This collaboration between 2022-2026 based at the Urban Institute has formed the basis of this beta version being launched.
The design and implementation of the Atlas and Database has been a challenge, technically but also from an analytical perspective in how/what/when is designated as corridor. Into the future we will discuss and reflect more on these challenges and limitations. For now, we present the resulting data visualisation that is emerging from our collective endeavour. It is intended to stimulate dialogue on the role of infrastructure corridors in the global economy, across extended urbanised terrains and the associated (geo)political implications. This has been based on collating thousands of data points and locations that the team has collected as part of our interrogations of these initiatives. The result is an interactive, web-based resource to explore xx separate corridors that span x countries across the globe, accounting for over x trillion dollars of planned/under construction/operating infrastructure investment, announced since 2008, our baseline year.
This beta version represents the first iteration of the Atlas and Database. It has been launched with the intention to be tested and elicit feedback from users through a process of technical validation. We are interested in your expert feedback concerning corridors and the investments we have documented, especially any data that has been missed or misreported, any new developments, financing arrangements or even proposed corridors, as well as any improvements we could make in developing this as a resource for other investigations. We want to make the Atlas and Database as accurate as possible while recognising the real limitations of our methodological approach and impossibility to document, categorise and map everything corridor related. However, with your support and input, that we will ensure is recognised, we know we can make this even better. We ask you to contact our team on this email address in order to provide any technical feedback . Please include the corridor(s) you are communicating about at the top of your email. We are also interested in your corridor related work so please do let us know if you are currently working on any of these issues and we will add you to the GlobalCORRIDOR newsletter.
Once we have been through the technical validation and made any necessary redesigns and revisions we will deposit the full database in an open access repository for use under Creative Commons with attribution, alongside hosting an online and future offline version of the Atlas and Database. We kindly ask that you do not under any circumstances use any data (either data or graphical form) at this stage while it is being validated and which is owned by the University of Sheffield until it is officially launched. Below we provide further information on how we have gone about creating this resource.
Professor Jonathan Silver, Dr Zhengli Huang, Dr Yannis Kallianos, Dr Fatima Tassadiq, Tom Flannery and Dan Farley (May, 2026).
What is a corridor?
The GlobalCORRIDOR Atlas and Database was developed to interrogate the technological led transformation of territory proceeding in multiple, often contradictory ways across every region of the planet. What our research group has previously termed ‘corridorisation’ (see Tassadiq et al, 2025). Corridors take on many different forms and functions. These initiatives have been termed variously as economic + development + infrastructure + growth + urban + maritime corridors amongst other labels and operate/governed/financed very differently across different geographical, governance, and institutional contexts. For the purpose of the GlobalCORRIDOR Atlas and Database we defined a corridor as:
Large scale infrastructure networks that cut across various territories, cities, countries and regions. These initiatives aim to materially integrate a new series of accumulation regimes out of historical conditions and geographical contexts. They operate to move people, and goods, resources and information and include trade, transportation and logistics routes in addition to other infrastructure investments and accompanying developments such as zones and enclaves.
In the GlobalCORRIDOR Atlas and Database we included only those large scale corridors that integrate various different infrastructure and technologies in a (1) multi-modal form and (2) cross national borders (future work will include some national-scale corridors).
Designing the Atlas and Database
The data visualisations are designed to reflect an emergent topography of infrastructure investment that has been integrated into broader corridors. Mapping has been used as a visual tool to represent infra-geography and the processes/patterns that are produced across territory. While it is often understood as a (spatial) science it is also based on abstraction, interpretation and particular ways of seeing the world. We designed the GlobalCORRIDOR Atlas and Database as a collaboration between our academic research team and our design/technology team, working in close proximity over a number of years to design/test/pilot/refine and redesign.
In order to advance the project, we followed an approach that began with creating databases populated by multiple data-points. We were not interested in stand-alone projects but rather those that intermediaries/authorities have deemed part of a broader initiative or that seem otherwise connected to a larger corridor initiative. We collected this data through a variety of approaches. We undertook close engagement with other attempts to develop databases of corridor initiatives. While there is no single source of data there were useful sources for regions or groups of corridors that have been invaluable. These include the academic-led Africa Development Corridors Database, as well as datasets held by corridor governing authorities including the TEN-T in Europe, the Greater Mekong region, and CAREC program, and other investment data from groups such as the China Aid Data and organisations such as the World Bank, Asian Development Bank, African Development Bank, as well as national/sub-national plans and policies. We also collated a huge amount of data through desk-based research practices including policy and documentary analysis, financial based reporting. Finally, we engaged key individuals and useful discussion with informative colleagues to further identify key information sources and verify data.
Stage 1 – Selection of a corridor
We identified any cross border, multi-modal infrastructure corridor. We plotted its ‘trendline’ i.e. the route it has been designed for and part of various plans. Sometimes these are singular lines but quite often these routes are more ‘networked’. While many of the corridors have official authorities and routes, others have required piecing together these ‘trendlines’ from various sources.
We then established groups of corridors through the identification of individual corridors into a Corridor Group and/or Region which denote bundles of shared regional geographies or governance initiatives and corridor scale. The Group and or Region provides a bundle of the various, sometimes overlapping corridors that permeate different territories providing data that establishes an overview of each individual corridor while also showing . The user can then zoom in to each particular corridor which provides a more detailed cartographic representation through place or route based mapping of each infrastructural investment (component) with further data being made accessible.
Corridors selected for the Atlas and Database included:
Belt and Road Initiative
China Pakistan Economic Corridor (CPEC); New Eurasian Land Bridge (NELB); China, Central Asia, West Asia Economic Corridor (CAWEC); China Mongolia Russia Economic Corridor (CMREC); China Myanmar Economic Corridor (CMEC), & Bangladesh-China-India-Nyanmar Corridor (BCIM); China-Indochina Peninsula Economic Corridor (CICPEC)
CAREC
CAREC 1, CAREC 2, CAREC 3, CAREC 4. CAREC 5 CAREC 6
Greater Mekong Subregion
East West Economic Corridor; North-South Economic Corridor; Southern Economic Corridor
Middle East and North Africa (MENA)
The Iraq Development Road; India-Middle East-Europe Economic Corridor (IMEC); Trans-Maghreb Multimodal Corridor ; The International North-South Transport Corridor (INSTC)
Central Africa
Libreville-Brazzaville-Pointe Noire Corridor; Douala Corridor; Kribi; Lobito Corridor; Bas Congo
East and South East Africa
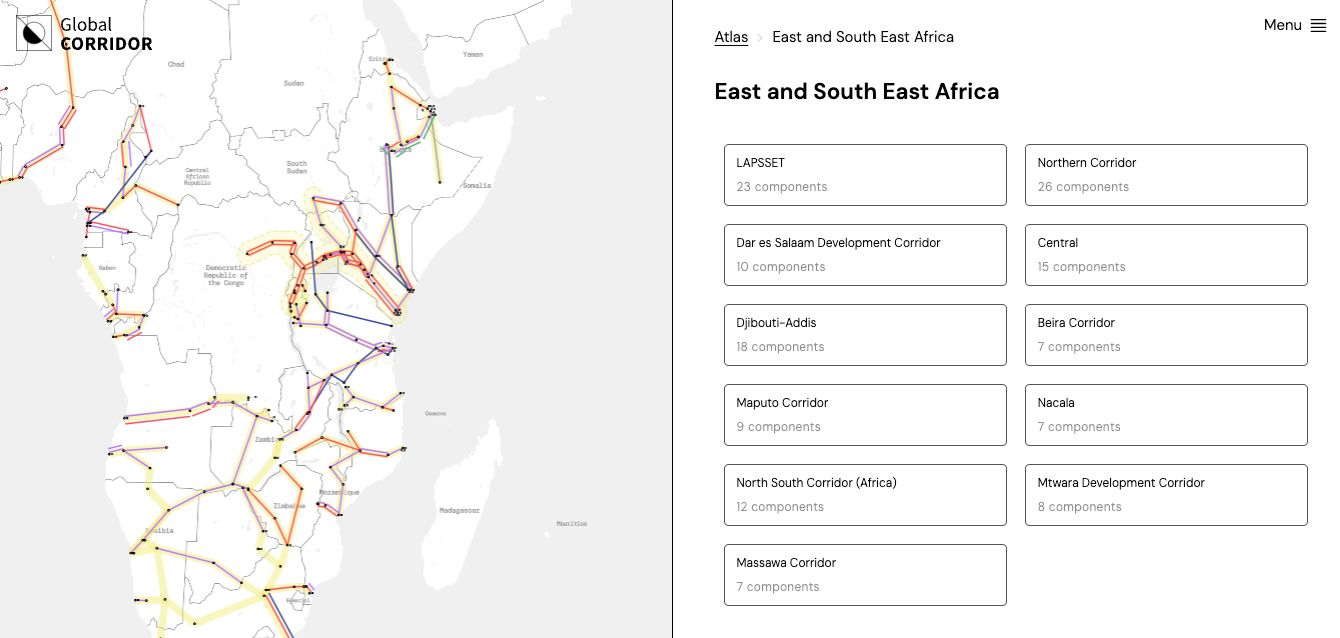
LAPSSET; Northern Corridor; Dar es Salaam Development Corridor; Central; Djibouti-Addis; Beira Corridor; Maputo Corridor; Nacala; North South Corridor (Africa); Mtwara Development Corridor; Massawa Corridor
Walvis Bay
Trans-Kalahari Corridor ; Trans-Oranje Corridor; Ndola-Lubumbashi Development Corridor; Trans-Cunene Corridor
West Africa
Praia-Dakar-Abidjan Corridor; Tema to Ouagadougou Corridor; Abidjan to Lagos Corridor; Dakar to Bamako Corridor; Trans-Saharan Corridor; Lome-Ouagadougou-Niamey (LON) Corridor
TEN-T Europe
Baltic-Adriatic; Mediterranean Corridor; North Sea-Baltic corridor; Atlantic Corridor; Rhine-Danube Corridor; Scandinavian-Mediterranean corridor; North Sea-Rhine-Mediterranean corridor; Baltic Sea-Black Sea-Aegean Sea corridor; Western Balkans-Eastern Mediterranean corridor
Americas
Peru-Brazil Bioceanic Corridor; Capricorn Bioceanic Corridor (CBC), CANAMEX Corridor
Stage 2 – Identification of all the infrastructure components for the corridor
We then identified any infrastructure investment valued at over $25 million and proposed/built or planned after 2008, that is either directly or indirectly associated with each corridor. These included;
- Inter-City Line + Road (Highway investments between two or more urban settlements)
- Inter-City Line + Rail (Rail investments between two or more urban settlements)
- Intra-City Line + Waterway (Canal investments between two or more urban settlements)
- Port (Any ocean or inland port facility including new terminal investments or whole new ports)
- Airport (Any airport directly associated with the corridor)
- Zone (Manufacturing zones, special economic zones, export zones)
- Enclave (Any large scale residential real estate development associated with the corridor)
- Energy (Any direct power generation facility directly associated with the corridor)
- Extraction (Any extractive infrastructure directly associated with the corridor)
- ICT + Digital (Any ICT or digital investment directly associated with the corridor)
- Intra-City Line + Road (Any road or highway within an urban settlement)
- Intra-City Line + Rail (Any rail infrastructure within an urban settlement)
Stage 3 – Data collection on each component based on our indicators
We then imputed data to correspond to up to 29 data indicators (where possible).
| Number | Attributes | Format | Description | Validation Required |
|---|---|---|---|---|
| 1 | Projext Code | Code | Each investment has a unique identifier | |
| 2 | Component Name | Text | The name used for the infrastructure project | Number of characters <100 |
| 3 | Component Type | Text | Port; Zone; Line (Road); Line (Waterway): Line (Intra-Urban); Enclave; ICT/Digital; Power Generation; Extractive; Airport | From list |
| 4 | City/Cities | Text | City/Cities where the component is located | Number of characters <100 |
| 5 | Country(s) | Text | Country(s) where the component is located | From list |
| 6 | Description | Text | Short outline of the key information on the project | Number of characters <1000 |
| 7 | Stated Objective | Text | Main objectives of the project | Number of characters <1000 |
| 8 | Status (as of 2024) | Text | Planned; Under-construction; Operational | From list |
| 9 | Date of Operation (if in operation) | Number | Year in which infrastructure project started operating | Year (must be in the past) |
| 10 | Distance (Line Only) or Size (Km2) | Kilometres | Reported length of the infrastructure project or size by km2 | Numerical digits |
| 11 | Distance (Line Only) | Kilometres | New, Rehabilitated and Existing | Numerical digits |
| 12 | Cost | US dollars | Investment cost to deliver the infrastructure project | Numerical digits |
| 13 | Capacity | Number | Range of different metrics based on capacity | Numerical digits |
| 14 | Cost ($) per KM (Line Only) | US dollars | Estimated cost of the project per km | Numerical digits |
| 15 | Type of finance | Text | Loan; investment; grant | From list |
| 16 | Financer(s) | Text | Name of financers of the project | Number of characters <200 |
| 17 | Amount per Financer/Donor | Text and US dollars | Amount per financer | Number of characters <200 and Numerical digits |
| 18 | Source of Finance | Text | National government; Regional Development Bank; Multi-lateral organisation, State bank, Development Agency, Private finance, other | From list |
| 19 | Country or Region of source of finance | Text | In-country, China, Asia (other); EU, Gulf, US, other | From list |
| 20 | Contractors | Text | Companies involved in the construction | Number of characters <200 |
| 21 | Country of contractors | Text | Country of HQ of the contractors | From list |
| 22 | Operators | Text | Organisations involved in the operation | Number of characters <200 |
| 23 | Country of Operators | Text | Country of HQ of the operators | From list |
| 24 | Primary governing authority | Text | Main authority involved in governing the infrastructure project | Number of characters <100 |
| 25 | Relation to corridor | Text | Direct; Indirect | From list |
| 26 | Changes of ownership | Text | Detailing any change of ownership over the infrastructure project | Number of characters <1000 |
| 27 | Notes | Text | Any other important observations | Number of characters <1000 |
| 28 | History | Text | Short historical information on the project | Number of characters <1000 |
| 29 | Reference, links, sources | Text | Link to sources of information | Number of characters <1000 |
Stage 4 – Mapping each corridor as a graphic visualisation
The GlobalCORRIDOR Atlas employs a form of graphic design led, data visualisation and mapping rather than detailed GIS mapping techniques because our primary intention was to visualise the data and make the resource easy to navigate and as a basis for further detailed investigation by the research team and other users. While we have endeavoured to make the data as cartographically accurate as possible we did not subscribe to the objective of mapping every twist and turn of a road or railway. We have used MapBox and Sanity to design a bespoke mapping and database system that provides live cartographic, data visualisation and analysis tools.
Navigating the Atlas
The Atlas has been designed as a data visualisation tool. To use it you can select a corridor group or region from the opening menu.
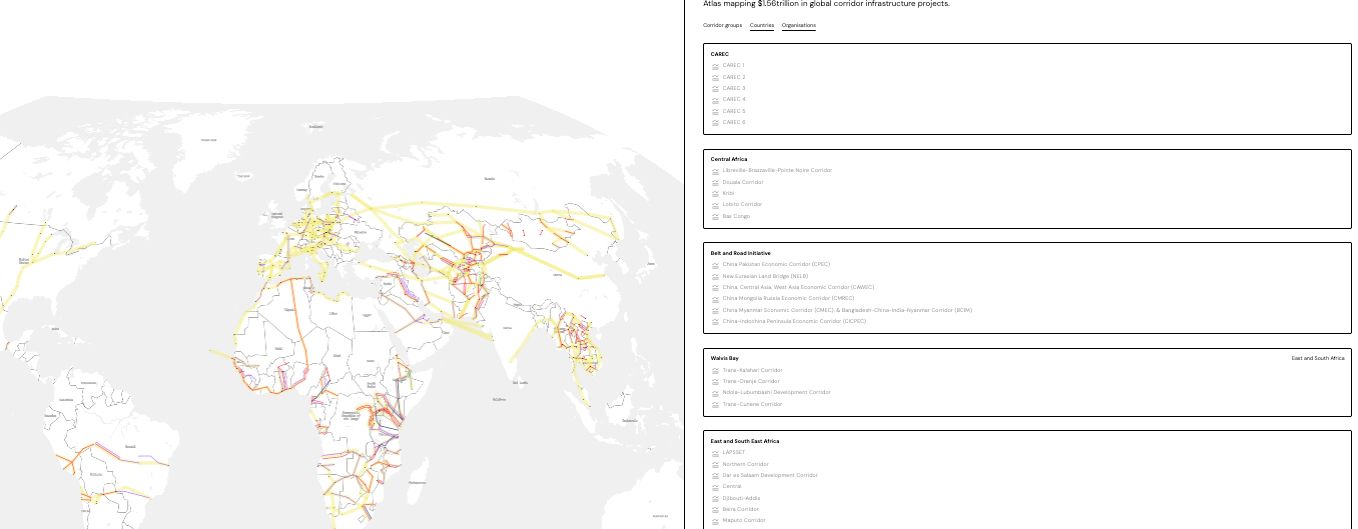
You also have the option to explore corridors through the countries or organisations involved.
If you select the corridor group/region, you can then select a corridor within this corridor group, so for example in East Africa you have the choice of the following corridors
You can then select one particular corridor, you will then find the range of infrastructure investments that constitute the corridor, as well as general information including the total investment cost, the estimated area/population within 50/100km of the corridor and an introduction to the corridor. You wll also find at the bottom of the page downloadable data and geo-date for the corridor (in the beta version this only includes limited information).
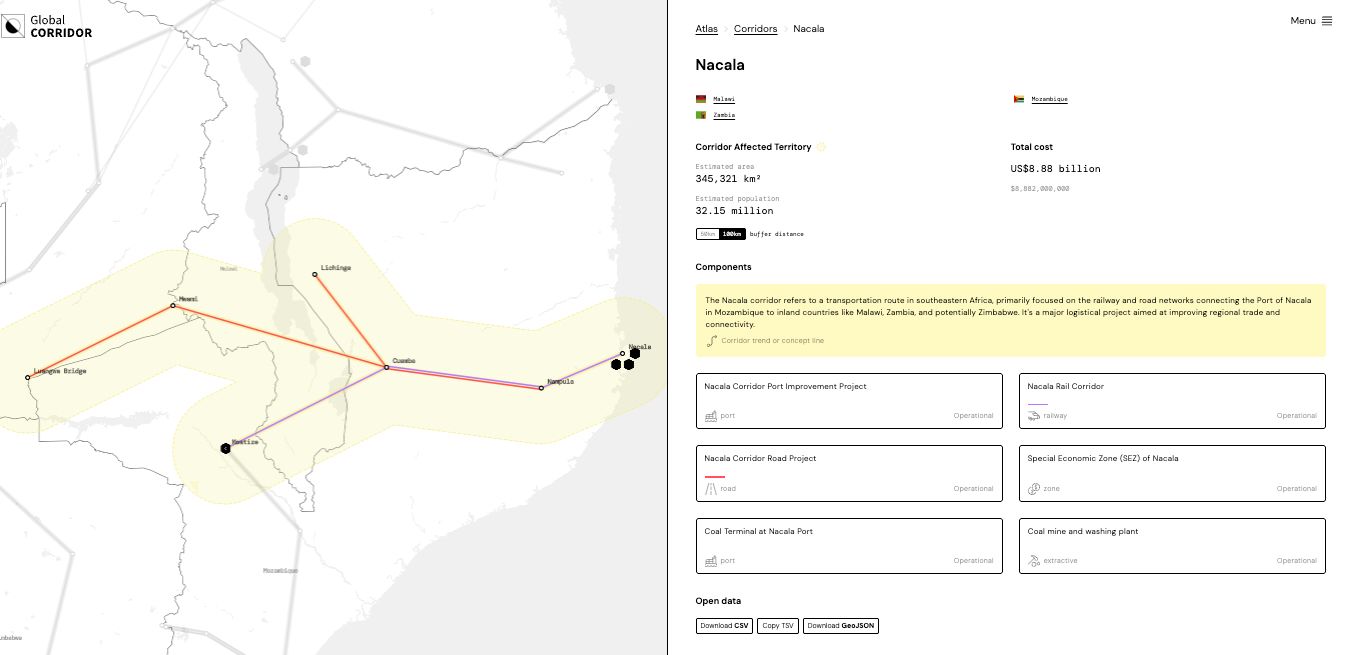
For infrastructure investment (or what we term ‘components’) a set of data and information is provided.
You can jump out of pages by clicking ‘back’ or by clicking on ‘Atlas’ at the top of the webpage.